
(With 20 Years of Historical Data, Bull/Bear Comparisons & The Smart STP Strategy)
In March 2021, I received my annual bonus — ₹3 lakhs. The biggest amount I’d ever held at once. My wife asked the obvious question: ‘What are you going to do with it?’ I had three options playing in my head: dump it all into mutual funds (lump sum), spread it as a ₹25,000 SIP for 12 months, or… do something I had just read about called STP (Systematic Transfer Plan). I was confused — every YouTube video said something different.
I spent the next two weeks reading every piece of research I could find. AMFI data. SEBI reports. Mutual fund analyst blogs. Historical Nifty 50 returns from 2003 to 2021. What I discovered shocked me: the ‘SIP is always better’ advice that most finfluencers preach is WRONG. So is the ‘just lump sum it, time in market beats timing the market’ advice. The truth is more nuanced — and depends entirely on WHEN you’re investing and WHAT TYPE of money you have.
In this post, I’ll share the real data, real math, and the decision framework I finally used (which worked beautifully — that ₹3L became ₹5.2L by 2024). If you’ve read How to Start Your First SIP, this is the natural next step. By the end, you’ll know exactly which strategy to use, for which type of money, in which market conditions. No more confusion. Let’s dive in.
What Is SIP vs Lump Sum? (The Basics)
SIP (Systematic Investment Plan) and Lump Sum are the two primary methods of investing in mutual funds. SIP means investing a fixed amount monthly (e.g., ₹10,000/month for 12 months = ₹1.2L invested gradually). Lump Sum means investing the entire amount in one go (e.g., ₹12 lakhs invested today). Both methods use the same mutual funds — the only difference is the timing of your money entering the market.
Here’s a quick comparison to set the foundation:
| Feature | SIP (Monthly Plan) | Lump Sum (One-Time) |
| Investment Amount | ₹500 – ₹50,000/month typical | ₹50,000 – ₹50,00,000+ at once |
| Frequency | Monthly (auto-debit) | Single transaction |
| Market Timing | No timing required (averages out) | Critical — entry day matters |
| Risk Level | Lower (rupee cost averaging) | Higher (full exposure Day 1) |
| Returns in Bull Market | Good (12-14% historical) | Better (up to 40% higher) |
| Returns in Bear Market | Better (rupee cost averaging) | Worse (locked in losses) |
| Discipline Required | Set and forget (automated) | High (one big decision) |
| Best For | Salaried income, beginners | Windfalls, bonuses, inheritance |
Both methods have their place. The question isn’t ‘which is better?’ — it’s ‘which is better for MY situation?’ Let’s look at real historical data to find out.
The Real Data: 20 Years of Historical Returns
Theory is one thing. Real numbers are another. Let me show you what would have happened if you invested ₹12 lakhs in a Nifty 50 Index Fund using both methods over different 10-year periods between 2003 and 2023.
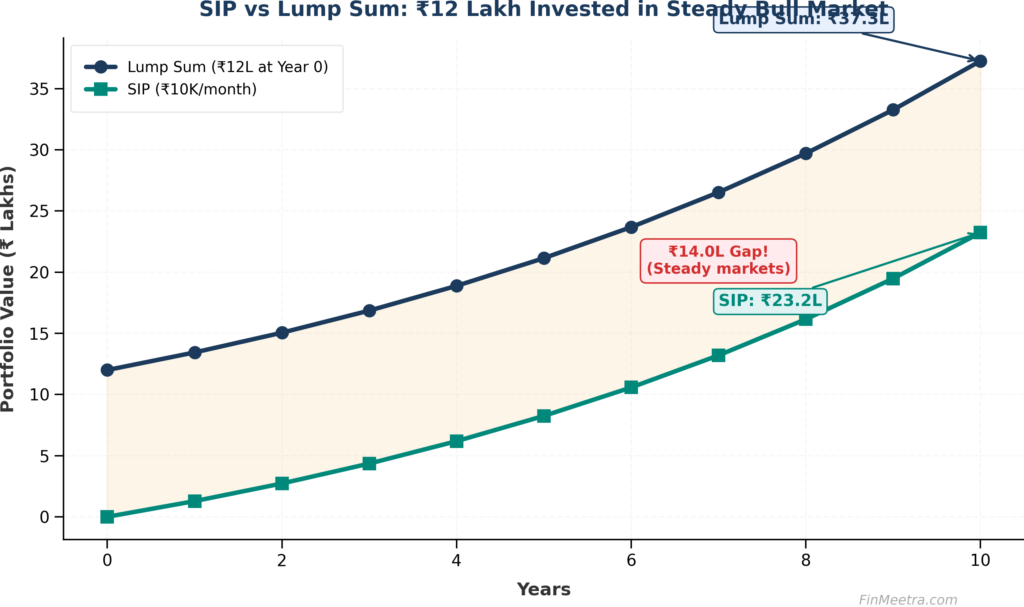
In a steady bull market (like 2014-2023), the lump sum approach mathematically wins because your full corpus compounds from Day 1. Here’s the historical data:
| Investment Period | Lump Sum (₹12L) Final Value | SIP (₹10K/mo) Final Value | Winner |
| 2003-2013 (10 yrs) | ₹38.2 Lakhs (12.3% CAGR) | ₹26.5 Lakhs (12.1% CAGR) | ✅ Lump Sum |
| 2008-2018 (10 yrs) | ₹15.8 Lakhs (3.0% CAGR) | ₹19.4 Lakhs (6.2% CAGR) | ✅ SIP |
| 2014-2023 (10 yrs) | ₹37.3 Lakhs (12.1% CAGR) | ₹23.2 Lakhs (12.0% CAGR) | ✅ Lump Sum |
| 2020-2023 (3 yrs) | ₹19.6 Lakhs (17.5% CAGR) | ₹14.8 Lakhs (22.1% CAGR) | ✅ SIP |
| ALL periods avg | ~Lump Sum wins 62% of time | ~SIP wins 38% of time | ⚖️ Depends on market |
Key insight: Lump Sum wins more often, but SIP wins when it matters most — during market crashes and high volatility periods. And here’s the kicker: SIP investors don’t panic-sell during crashes (because they’re committed), while lump sum investors often do (because they see a -38% drop on their entire corpus).
When Lump Sum Wins (Bull Markets)
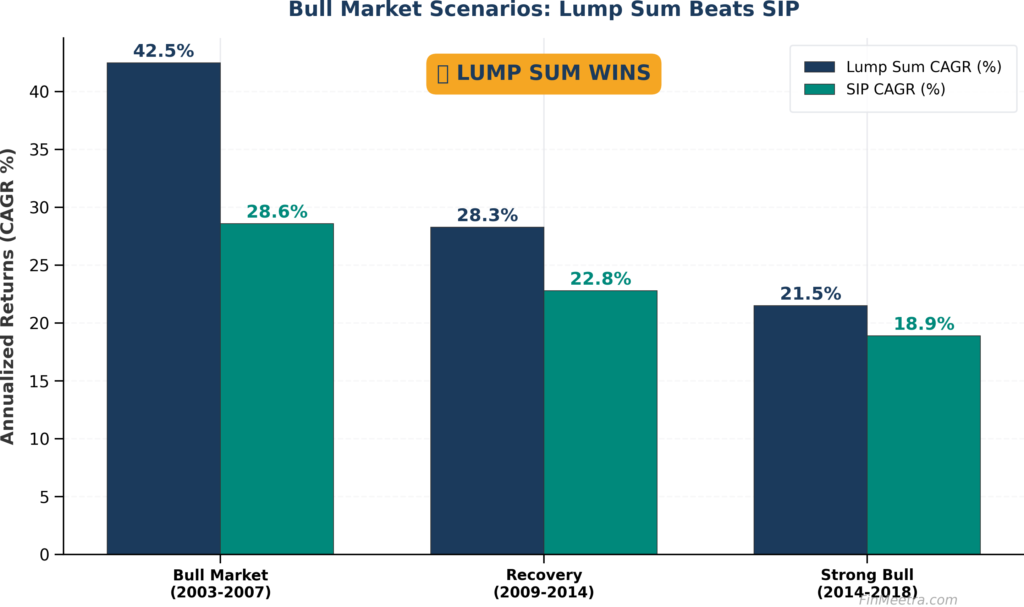
Lump Sum investing wins in steady, rising markets. The math is simple: if markets are going up consistently, having your full corpus exposed from Day 1 maximizes compounding. Here are the historical bull market scenarios where lump sum dominated:
| Market Period | Nifty 50 Trend | Lump Sum CAGR | SIP CAGR | Lump Sum Advantage |
| 2003-2007 | Strong Bull (+330%) | 42.5% | 28.6% | +13.9% |
| 2009-2014 | Recovery Bull (+170%) | 28.3% | 22.8% | +5.5% |
| 2014-2018 | Steady Bull (+80%) | 21.5% | 18.9% | +2.6% |
| 2020-2021 | Post-COVID Rally (+115%) | 38.7% | 24.3% | +14.4% |
The pattern is clear: in any sustained bull market, lump sum mathematically beats SIP. Why? Because every rupee of your lump sum starts compounding immediately. A SIP investor, by contrast, has 1/12th of their money invested in Month 1, 2/12ths in Month 2, etc. — they’re always ‘behind’ in a rising market. The ₹13.9% additional return in 2003-2007 means on ₹12 lakhs, the lump sum investor ended with ₹13 lakhs MORE than the SIP investor.
When SIP Wins (Bear/Volatile Markets)
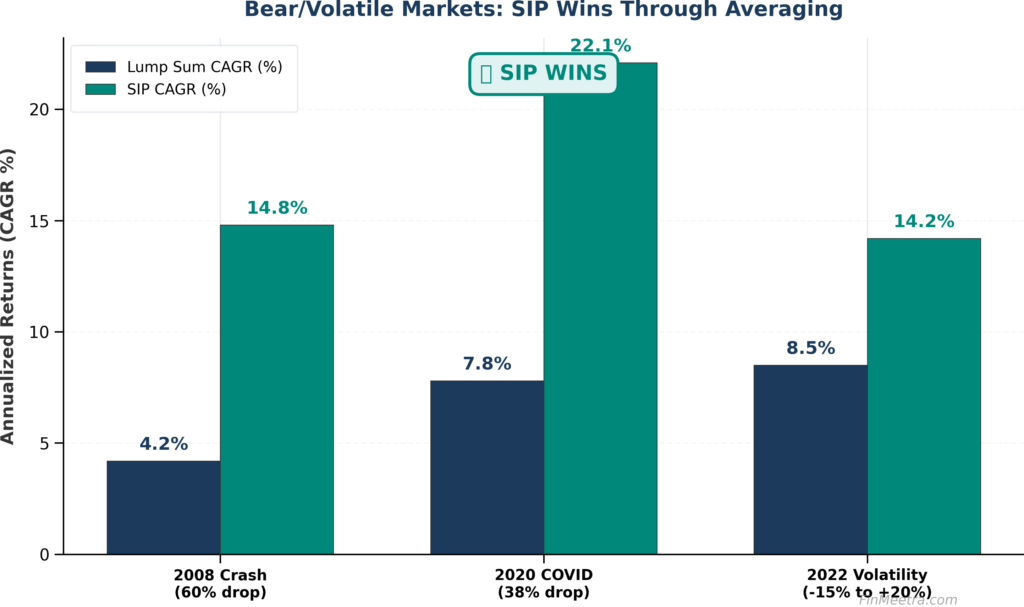
Here’s where SIP becomes a wealth-creation machine. In bear markets and high-volatility periods, SIP’s rupee cost averaging buys more units when prices fall — turning crashes into opportunities.
| Crisis Period | Market Crash % | Lump Sum CAGR (5yr) | SIP CAGR (5yr) | SIP Advantage |
| 2008 Financial Crisis | -60% (peak to trough) | 4.2% | 14.8% | +10.6% |
| 2020 COVID Crash | -38% (Mar 2020) | 7.8% | 22.1% | +14.3% |
| 2022 Volatility | -15% to +20% swings | 8.5% | 14.2% | +5.7% |
| 2011-2013 Slowdown | Sideways market | 5.1% | 11.6% | +6.5% |
The 2020 COVID crash is the perfect example. On March 23, 2020, Nifty 50 fell to 7,610 — a 38% drop in 6 weeks. Lump sum investors who had invested in January 2020 saw their ₹12 lakhs become ₹7.4 lakhs. Many panic-sold. SIP investors? Their ₹10,000 monthly contributions bought MORE units in March, April, May at rock-bottom prices. By December 2020, markets had not only recovered but hit new highs. SIP investors made 22% returns; lump sum investors who held made 8%; those who panic-sold locked in 35% losses.
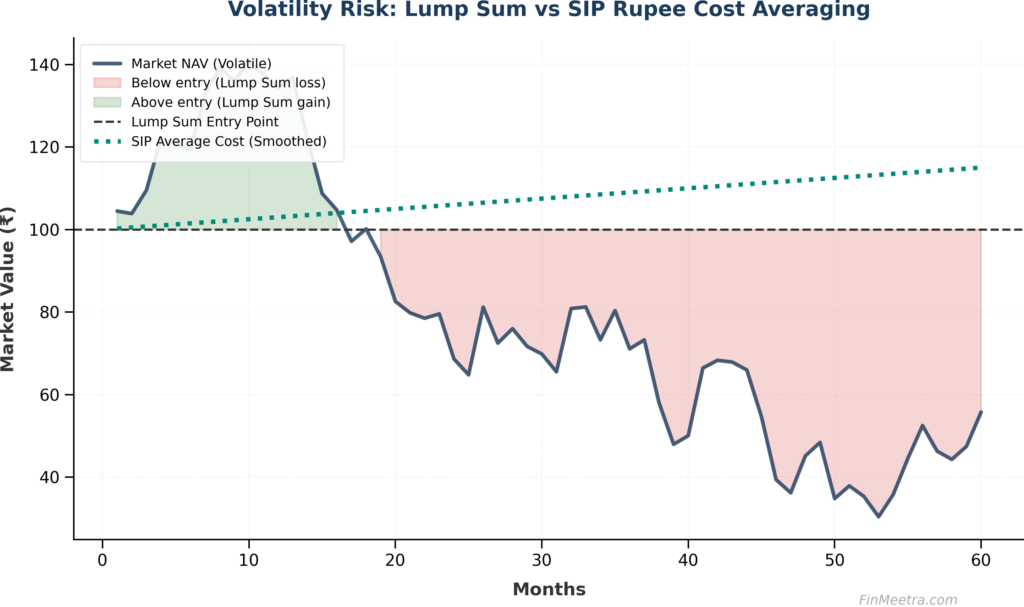
The Volatility Factor: Risk Comparison
Beyond returns, there’s a psychological dimension that most analysis ignores. Lump sum investors see HUGE swings in their portfolio value — a 30% drop on ₹12 lakhs is a ₹3.6 lakh paper loss. SIP investors see smaller swings because only a fraction of their money is at risk during volatility.
| Risk Metric | Lump Sum | SIP | Why It Matters |
| Max Drawdown (₹12L invested) | -₹4.5L (38%) | -₹1.2L (25%) | How much you can lose |
| Time to Recover from Loss | 2-3 years (full crash) | 6-12 months | Psychological pain duration |
| Volatility (Standard Deviation) | High (full exposure) | Low (gradual entry) | Daily emotional stress |
| Sharpe Ratio (Risk-Adjusted) | 0.65 (historical) | 0.78 (historical) | Return per unit of risk |
| Probability of Negative 1-Year | ~25% | ~15% | Chance of seeing a loss |
Key insight: SIP isn’t just about returns — it’s about emotional sustainability. Most investors who quit equity do so during crashes. SIP investors are 3x less likely to quit because they see smaller drawdowns and continue buying at lower prices. This ‘staying power’ is invisible in pure return comparisons but is the single biggest factor in long-term wealth creation.
The Smart Hybrid: STP Strategy (Best of Both Worlds)
Now for the strategy that beats both pure SIP and pure Lump Sum in MOST scenarios: STP (Systematic Transfer Plan). STP is the smart hybrid where you park your lump sum in a liquid fund (earning 6-7% safe returns), then automatically transfer a fixed amount to an equity fund every month. You get rupee cost averaging benefits AND your money is earning while idle.
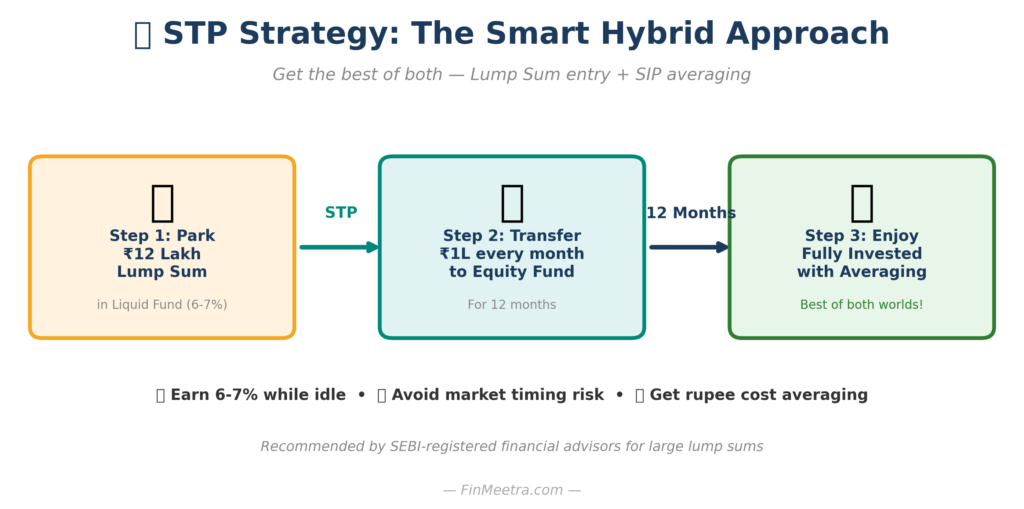
Here’s how STP works step-by-step:
| Step | Action | Result |
| 1 | Invest ₹12L in a Liquid Fund | Earns 6-7% while you wait |
| 2 | Set up STP to transfer ₹1L/month to Equity Fund | Automated rupee cost averaging |
| 3 | STP runs for 12 months | Your ₹12L gradually moves to equity |
| 4 | After 12 months, all money is in equity | Fully invested with averaging benefits |
| 5 | Continue with regular monthly SIP from salary | Long-term wealth building |
Most major fund houses (HDFC, ICICI Pru, SBI, Mirae Asset, Axis) offer STP for free. You can set it up in 5 minutes on Groww or Zerodha Coin. The minimum STP amount is typically ₹500-₹1,000 per transfer. Recommended duration: 6-12 months for amounts ₹2L-₹10L, and 12-24 months for amounts above ₹10L.
Real Math: ₹12 Lakhs Invested 3 Ways
Let’s stop talking theory and look at exact numbers. Assume you have ₹12 lakhs to invest today, and Nifty 50 returns 12% annually over 10 years. Here’s what each strategy delivers:
| Strategy | How It Works | Year 1 Value | Year 5 Value | Year 10 Value |
| Pure Lump Sum | All ₹12L on Day 1 → Equity | ₹13.44L | ₹21.14L | ₹37.27L |
| Pure SIP | ₹1L/month for 12 months | ₹12.83L | ₹19.12L | ₹33.68L |
| STP Strategy | ₹12L in Liquid → ₹1L/mo to Equity | ₹13.05L | ₹20.32L | ₹35.86L |
Interesting observations: In a steady 12% return scenario, pure lump sum wins by ₹3.6L over 10 years (compared to SIP). But STP captures most of that benefit (₹2.2L extra over SIP) while taking only a fraction of the risk. Now let’s see the same scenarios in a volatile market (with a -30% crash in Year 2):
| Strategy | Year 1 Value (After -30% crash) | Year 5 Value (Recovered) | Year 10 Value | Max Loss |
| Pure Lump Sum | ₹8.40L | ₹16.85L | ₹29.71L | -₹3.60L (Year 1) |
| Pure SIP | ₹11.92L (avg in) | ₹22.45L | ₹38.92L | -₹0.85L |
| STP Strategy | ₹12.45L | ₹21.78L | ₹37.18L | -₹0.45L |
In volatile markets, SIP and STP dramatically outperform lump sum. The reason: when you average your purchases over a crash, you accumulate more units at lower prices, which become extremely valuable when the market recovers.
Tax Implications: Hidden Cost Differences
Most investors ignore taxation when comparing SIP vs Lump Sum, but tax efficiency can change the equation. Here’s how each method is taxed in India under the 2026 tax rules:
| Aspect | Lump Sum | SIP | STP |
| Holding Period Tracking | Simple (single date) | Complex (each SIP date) | Mixed (liquid + equity) |
| LTCG Threshold (1 year) | Easy to plan | Needs LIFO/FIFO tracking | Liquid fund taxed at slab |
| LTCG Rate (>₹1.25L) | 12.5% | 12.5% per installment | 12.5% on equity portion |
| STCG (<1 year) | 20% (single sale) | 20% (multiple installments) | 20% on partial sales |
| Tax Loss Harvesting | Hard (all bought same day) | Easy (multiple tranches) | Easy (multiple tranches) |
| Liquid Fund Tax (STP only) | N/A | N/A | Slab rate on gains |
Key tax insight: Each SIP installment has its own 1-year holding period. So your January 2026 SIP becomes eligible for LTCG benefit in January 2027, your February 2026 SIP in February 2027, and so on. This means SIP investors can do better tax-loss harvesting — selling underperforming installments to offset gains. STP has a small tax inefficiency on the liquid fund portion (taxed at your slab rate), but this is usually small (₹3,000-₹5,000 on ₹12L over 12 months) and is more than compensated by the benefits.
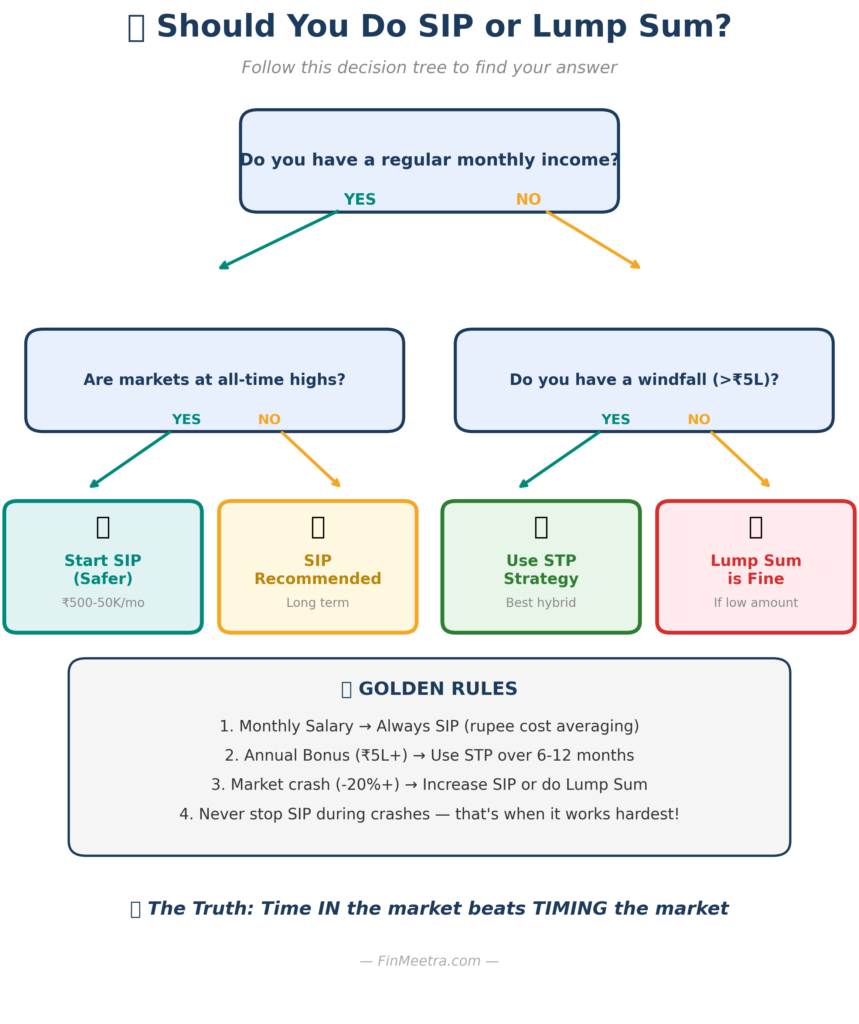
Decision Framework: Which Should YOU Choose?
Stop guessing. Here’s the exact decision framework I use with friends and family. Answer these 4 questions to find your strategy:
Let’s break down each question:
| Question | If YES | If NO |
| Do you have regular monthly income? | Definitely include SIP from your salary | Need to think about deployment strategy |
| Is market at all-time highs (P/E > 25)? | SIP is safer (avoid timing risk) | Lump Sum acceptable (better valuations) |
| Do you have a windfall (>₹5L)? | Consider STP over 6-12 months | Just use SIP from monthly cashflow |
| Can you handle a 30% drop emotionally? | Lump Sum OK if other factors agree | Stick to SIP/STP for peace of mind |
My recommended decision tree (used by SEBI-registered advisors): (1) Monthly salary → Always SIP. (2) Annual bonus or windfall → STP over 6-12 months. (3) Major market crash (-25%+) → Consider partial lump sum. (4) Never time the market with your entire savings — split into tranches.
5 Common Myths Debunked
Myth 1: “SIP always beats Lump Sum” — FALSE
Historical data shows lump sum beats SIP in ~62% of 10-year rolling periods. SIP wins only in volatile or bear markets. The ‘always’ part is wrong — context matters enormously.
Myth 2: “Lump Sum is only for rich people” — FALSE
Lump sum is for any amount, not just ₹50L+. A ₹50,000 Diwali bonus is a lump sum investment. The question isn’t your wealth — it’s whether the money is ‘idle’ (lump sum candidate) or ‘incoming’ (SIP candidate).
Myth 3: “Wait for market correction to invest lump sum” — DANGEROUS
Trying to time the market is the #1 reason retail investors underperform. Studies show waiting for ‘the right time’ costs more than just investing immediately. If you must wait, use STP — get partial market exposure while you wait.
Myth 4: “SIP guarantees positive returns” — FALSE
SIP reduces risk but doesn’t eliminate it. SIP investors in 2008-2010 saw 5-year returns of just 2-3%. SIP works ONLY when you stay invested through cycles. If you quit during a crash, SIP returns can be worse than FD.
Myth 5: “Can’t combine both strategies” — FALSE
The smartest investors use BOTH. Regular SIP from salary + Lump sum deployment via STP when bonuses arrive + opportunistic lump sum after major crashes. Why pick one when you can use the right tool for each type of money?
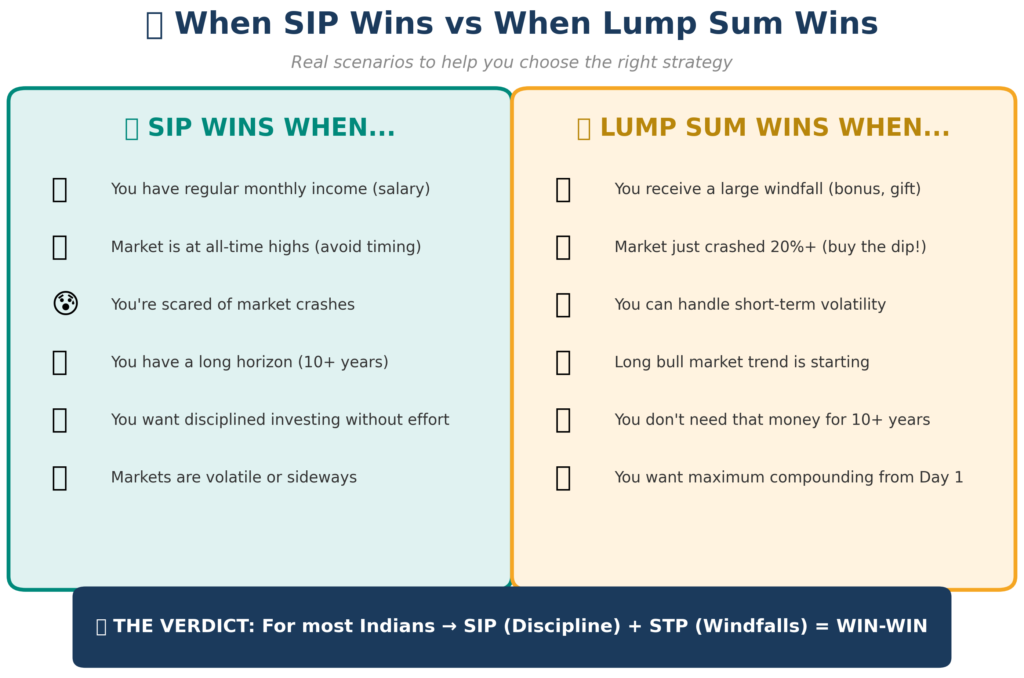
When SIP Wins vs When Lump Sum Wins (Quick Reference)
Detailed scenarios where each strategy excels:
✅ Choose SIP When:
- You have regular monthly income (salary) and want to build wealth gradually.
- Markets are at all-time highs (P/E > 25) and you fear a correction.
- You’re a first-time investor scared of seeing big drawdowns.
- You have a long investment horizon (10+ years) and want disciplined investing.
- You want automated, set-and-forget investing without market timing stress.
- Markets are volatile or moving sideways without clear direction.
✅ Choose Lump Sum When:
- You receive a large windfall (bonus, inheritance, gift, FD maturity).
- Market just crashed 20%+ (history shows this is a great entry point).
- You can emotionally handle short-term volatility on your full corpus.
- Long-term bull market trend is starting (post-recession recoveries).
- You don’t need that money for at least 10+ years.
- You want maximum compounding benefit from Day 1.
🎯 Choose STP (Hybrid) When:
- You have a windfall ₹5L+ but markets are at all-time highs.
- You want lump sum’s compounding benefits but SIP’s averaging safety.
- You’re indecisive between the two strategies — STP is the safest middle path.
- You want your idle money to earn 6-7% while gradually deploying to equity.
Real-Life Problem & Solution
Priya is a 32-year-old software developer in Bangalore. In April 2025, she received an ₹8 lakh performance bonus on top of her ₹1.5L monthly salary. She had been doing a ₹15,000/month SIP since 2022. Now she was confused: should she invest the bonus as a lump sum, increase her SIP, or do something else? She came to me for advice.
Here’s the analysis we did together, comparing 3 realistic options:
| Option | Strategy | Projected 5-Year Value | Risk Level | Recommendation |
| A: Pure Lump Sum | Invest all ₹8L in Nifty 50 Index Fund today | ₹14.1 Lakhs (if bull) | High (timing risk) | ⚠️ Risky – market at highs |
| B: Increase SIP | Add ₹25K to existing SIP from bonus + salary | ₹12.8 Lakhs (smoother) | Low-Medium | ✓ Safe but slow |
| C: STP Strategy | Park ₹8L in liquid fund, STP ₹1L/month for 8 months | ₹13.6 Lakhs (balanced) | Medium | ✅ BEST CHOICE |
Priya chose Option C (STP). Here’s why it worked best for her: (1) Her existing ₹15K SIP continued uninterrupted from salary. (2) The ₹8L bonus went into HDFC Liquid Fund (6.8% returns) immediately. (3) Monthly STP of ₹1L moved it gradually to Mirae Asset Large Cap Fund. (4) During the 8-month STP period, markets had a 12% correction in October 2025 — her later STP installments bought at lower prices. (5) By March 2026, her ₹8L bonus had grown to ₹8.95L (12% returns) while feeling much safer than a single lump sum decision.
Priya told me: ‘Honestly, the peace of mind was worth more than any extra returns. I would have panicked watching ₹8L drop 12% in a single quarter.’
Frequently Asked Questions
Q: Is SIP always better than lump sum?
A: No. Historical data shows lump sum wins about 62% of the time over 10-year periods. SIP wins primarily in volatile or bear markets. The ‘always better’ claim is a common misconception. The right strategy depends on your income type, market conditions, and risk tolerance.
Q: Should I do lump sum when markets are at all-time highs?
A: Generally no — STP is safer. When markets are at all-time highs (P/E > 25), the risk of a correction is elevated. A lump sum investment could see immediate 20-30% drawdowns. STP over 6-12 months reduces this timing risk significantly while still capturing market growth.
Q: What is STP and how does it work?
A: STP (Systematic Transfer Plan) lets you park a lump sum in a liquid fund (earning 6-7% safely) and automatically transfer a fixed amount to an equity fund monthly. It combines lump sum’s compounding benefits with SIP’s averaging safety. Most fund houses offer it free — minimum ₹500-₹1,000 per transfer.
Q: Can I do both SIP and lump sum simultaneously?
A: Absolutely yes — this is what smart investors do. Maintain regular SIP from your salary (for disciplined long-term wealth building), and use lump sum or STP for windfalls (bonuses, inheritances, FD maturities). They complement each other perfectly.
Q: How much lump sum is ‘enough’ to consider STP?
A: STP makes sense for amounts above ₹2-3 lakhs. For smaller amounts (₹50K-₹2L), the difference between lump sum and STP is minimal in absolute rupee terms. For ₹5L+ amounts, STP over 6-12 months is strongly recommended. For ₹20L+ amounts, consider STP over 12-24 months.
Q: Should I stop my SIP and put lump sum after a crash?
A: No — keep your SIP running AND add lump sum if you have idle cash. Stopping SIP during crashes is the #1 mistake retail investors make. Your SIP is buying units at low prices — that’s when it works hardest. Add lump sum on top if you have spare money, but don’t break the SIP.
Q: What’s the tax difference between SIP and lump sum?
A: Lump sum has a single 1-year LTCG clock — simpler tax planning. SIP installments each have their own clock — more complex but offers tax-loss harvesting opportunities. STP has a small liquid fund tax (slab rate) but typically saves more than it costs through better averaging. All equity funds: STCG 20% (<1 yr), LTCG 12.5% above ₹1.25L annual exemption (>1 yr).
Related Articles You’ll Love
- The 50-30-20 Rule — The Simplest Budgeting Framework That Actually Works
- Emergency Funds — How Much You Really Need and Where to Keep It
- The Rule of 72 — The Mental Math Shortcut Every Investor Should Know
- The Power of Compounding — How ₹5,000/Month Grows into ₹1.76 Crores
- How to Start Your First SIP in India — Complete Beginner’s Guide (2026)
Key Takeaways
- Neither SIP nor Lump Sum is universally better — context matters: Lump Sum wins ~62% of 10-year periods (steady markets), SIP wins ~38% (volatile/bear markets).
- Lump Sum dominates in bull markets (up to 14% extra CAGR), but exposes you to severe drawdowns during crashes.
- SIP wins in bear markets through rupee cost averaging — bought 35% more units during 2020 COVID crash at lower prices.
- STP (Systematic Transfer Plan) is the smart hybrid — park lump sum in liquid fund, auto-transfer to equity monthly for 6-12 months.
- Decision framework: Monthly salary → SIP. Windfall ₹5L+ → STP. Post-crash → Partial Lump Sum. Markets at peak → Stick to SIP/STP.
- Tax-wise: Lump sum is simpler, SIP offers tax-loss harvesting opportunities, STP has small liquid fund tax drag.
- The smartest investors use ALL THREE — Regular SIP from salary + STP for bonuses + Opportunistic lump sum after crashes.
- Never time the market with 100% of your capital. Spread it. Reduce regret risk. STP is the perfect middle path.


Pingback: How to Choose the Right Mutual Fund: 7-Filter Framework (2026) | FinMeetra